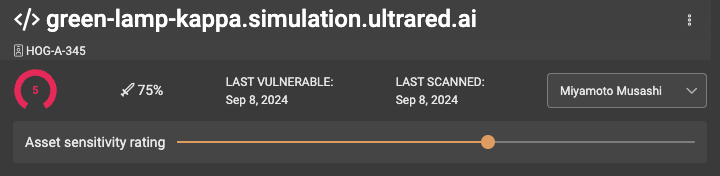
Continuing our focus on customization, we’re introducing a new way for you to rate your assets based on their sensitivity to your organization. Some assets may require immediate attention in the event of a critical vector, while others may not. To address this, we’ve added a sensitivity slider to the Asset Details overlay. The slider features 6 steps, from 0 to 5, corresponding with the asset scores, giving you more control over prioritizing asset management.
We’ve completed adding widgets from all pages across the platform. Now, any graph, chart, or counter you’re familiar with can be included in your Custom Dashboards, making it easier to monitor and manage key metrics in one place.
Additionally, we’ve introduced the ability to set a Default Active Dashboard. Users with the Operator role and above can now configure a default dashboard that will load automatically for all users when they access the Custom Dashboards page for a target.

We’ve added two new filters to the Asset Management screen to help you better understand the links and connections between your assets. The Parent Assets filter allows you to view all assets discovered from a specific parent asset. Additionally, the Relations filter—available also on the Discovery page—lets you filter assets based on their relationships to other assets, providing deeper insights into your external attack surface.
