We’ve integrated VITA into the Asset Management screen to help you find what you need, fast.
Now in closed beta, this new free-text search lets you query across assets and everything linked to them.
Want to give it a try? Contact your partner or ULTRA RED contact person to opt in.


We're excited to bring you another round of updates designed to further streamline your workflow and enhance your visibility into your assets and vectors. This update includes improvements to reporting, brand-new widgets for the custom dashboards, important API enhancements, and built-in playbooks to simplify your security management from the get-go.
We've expanded the range of scheduled reports, now you can automatically schedule generation for the following reports:
Simply set your preferred schedule, and let ULTRA RED handle the rest!

We've introduced new enrichment-focused widgets:

We've enhanced our API functionalities for more detailed and customized queries:
To help you get started even faster, every newly created target now comes equipped with eight built-in playbooks. These playbooks are initially turned off, allowing you the flexibility to activate them as needed.

Managing cybersecurity involves sifting through vast amounts of data. ULTRA RED continuously gathers comprehensive details about your digital assets, aggregating crucial information like vectors, technologies, ports, and metadata into intuitive charts. While our dashboards already simplify visualizing this information, the introduction of filterable widgets enables even greater precision, empowering you to create specialized dashboards tailored specifically to your needs.
This newsletter is the first in a series designed to demonstrate various practical use cases for leveraging ULTRA RED's Custom Dashboards. Keep an eye on your inbox for future installments, each offering helpful insights and guidance to optimize your daily activities and compliance efforts.
Let’s look at how the new widgets can support ISO 27001 compliance — a well-known framework in cybersecurity. Here's how ULTRA RED's dashboards can help you address key requirements:


We're back with another round of updates to make your experience on ULTRA RED smoother, more informative, and customizable. Here's what's new:
We’ve introduced a new tab in the Asset Details overlay called Scan Activity, which lets you see real-time scanning activities on your assets. Currently, it logs activities from the Vector scanner, specifically when scans start and finish. Soon, we'll enhance this with additional scanners and detailed results for each scan.

Your Custom Dashboards just got even better! We've added filtering capabilities to most widgets, allowing you to drill down into the data you care about most. Previously, you could only have one instance of a widget per dashboard. Now, by applying filters, you can add multiple instances of the same widget, each configured differently to suit your specific needs.
To apply filters, simply click the context menu (the three dots) on the widget

And select the new filter option to customize your view.

We've enriched our API responses with more valuable data:
We're back with some updates to enhance your ULTRA RED experience. Here’s what's new:
You can now export your custom dashboard—including all widgets and their data—into a handy report. Currently, this export is available only from your default dashboard (set by clicking the star icon next to the dashboard’s name). If no default is selected, the export will come from the first dashboard on your list.

To generate the report, simply click the ribbon icon on the top-right corner of the dashboard. The report will begin generating in the background, and once ready, you'll receive a notification.
You can schedule regular automatic generation of the Custom Dashboard report through the Configuration screen under Target Management. There, you can select a preferred day of the week, and the report will be created automatically at 04:00 UTC on your chosen day. This ensures you always have the latest insights ready when you need them. More scheduling flexibility will be available in upcoming releases. Stay tuned!

ULTRA RED was recently made available in Japanese! You can switch languages by clicking on your profile icon in the top-right corner. The translation is currently around 70% complete, with more updates coming soon to fully support Japanese-speaking users. In this release, we have added localization to all the PDF reports on the platform. If your interface is set to Japanese any PDF report you generate will automatically be in Japanese.

We've added a practical new widget to your dashboard—the Notes widget. Found under the General section in the Widget inventory, it allows you to document activities, create to-do lists, and share notes with your team, ensuring seamless collaboration and better tracking of your tasks.

With this release, you can search across multiple targets at once, automate more actions via API, and gain deeper insights into malware vectors with VITA. Plus, new filters and sorting options make navigating your data simpler than ever.
Searching across multiple targets just got easier. A new Advanced Search button on the Targets screen allows you to search for asset and vector names across multiple targets without needing to enter each one individually. Simply select whether you’re searching for an asset or a vector and find what you need in seconds.

When dealing with a large number of assets, waiting for the Discovery page to load can feel like a guessing game. To improve visibility, we’ve added a progress bar when there are more than 10,000 assets in the Discovered Assets column. This indicator will help you gauge how long it will take for the page to fully load.

To prevent accidental disruptions, we’ve introduced a confirmation prompt before revoking or regenerating an API token. Since these actions affect all users with access to the same API, this extra step ensures changes are made intentionally.

Our API capabilities are expanding! In addition to retrieving data, you can now perform actions directly via API, streamlining integrations and automation. New supported actions include:
For more details, check out the API documentation.
Playbooks now offer more precision when handling unvalidated CVEs under enrichments. You can now use CVSS scores as a condition in the “New Enrichment Found” playbook trigger, ensuring that only relevant findings trigger automated workflows.

VITA is now available for Malware Vectors. You can ask VITA questions, gain deeper insights, and receive remediation guidance just like with other vector types.
We’ve added new sorting options to the Reports screen, making it easier to locate the reports you need. You can now sort by:

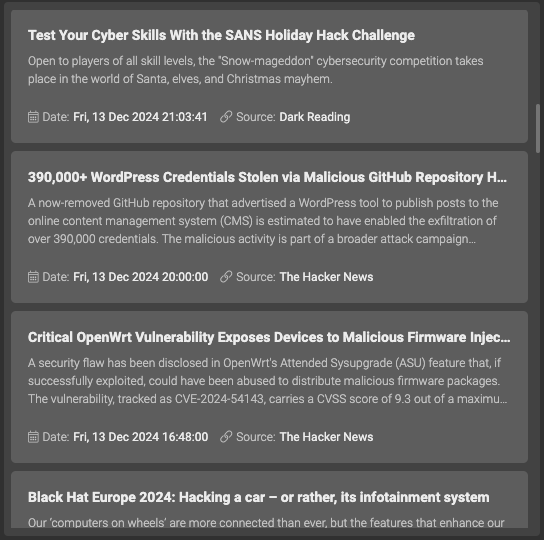
Keeping up with cybersecurity news is like drinking from a firehose. Every day, new vulnerabilities emerge, attack techniques evolve, and security teams race to keep up. That’s why we introduced the Cybersecurity RSS widget—a dedicated space in your Custom Dashboards that continuously pulls in the latest headlines from top security sources.
But let’s be honest—who has time to sift through every article?
That’s where VITA comes in. With the latest update, our AI chatbot now analyzes the daily feed and delivers a concise summary straight to your inbox so you don’t have to. Each day, VITA scans the top articles and sends you:
• The 3 most critical security incidents or vulnerabilities to stay on top of.
• Emerging attack patterns and trends that might signal what’s coming next.
• Key recommendations for security teams to take action.
This summary is based solely on public cybersecurity news—no customer data is analyzed or used.
This is a free, opt-in feature and is not enabled by default and not dependent on a VITA license. If you’d like to receive these daily cybersecurity briefings, giving you a quick, digestible rundown of what matters most—without needing to jump between news sites or sort through endless updates, contact your ULTRA RED representative or partner to activate it for your account.
If you haven’t checked out the RSS widget yet, now’s a good time to add it to your Custom Dashboards. And if you want VITA’s daily cybersecurity digest, just let us know!
We are here to share the latest enhancements designed to refine your experience with ULTRA RED. This update includes greater control, improved organization, and enhanced usability across the platform.
A new capability in path and directory scanning. While previously you could define domains and subdomains for scanning, you can now specify exact paths within them. Additionally, if your wordlist contains only words (without “/”), it will be used to enumerate directories.
By default, wordlist uploads support files up to 40KB, equivalent to ~200 lines with up to 200 characters each. For more extensive needs, a paid upgrade is available to increase this limit to 500KB, accommodating up to 2,500 lines.


We’ve extended our API functionality with the following updates:
The asset details overlay has been redesigned for better organization and future enhancements. All the data is now separated into the following dedicated tabs:

Ever come across a finding you’ve already reviewed and know doesn’t need further action? With this new feature, you can mark such findings as “Safe.” Whether it’s an outdated technology, an enrichment, or an open port, this lets you flag it as handled—so next time, you’ll know at a glance that it’s already been addressed.


When we set out to rethink how users interact with their data on ULTRA RED, we asked ourselves a simple question: What would make the experience not just functional, but flexible? That’s where Custom Dashboards came in. We wanted to give you a workspace that feels uniquely yours—a place where you can shape how you see your security world, pull out what’s important, and leave behind the rest.
Let’s talk about what’s inside. At launch, we gave everyone four dashboards, designed to address the most common needs:
But we know everyone’s priorities are different. That’s why you can create up to seven dashboards. Some of our users are building their own take on:
The possibilities don’t stop there. Every one of the 30+ widgets on ULTRA RED has been reimagined for this experience. Add them from their usual spots on the platform, or through the Widget Inventory Overlay—it’s all just a few clicks away. And because life is better when things stay organized, you can also set a default active dashboard, reorder tabs, and even import/export dashboards to keep everyone on the same page.
This isn’t just another way to view your data; it’s a way to tell your story with it. Whether you want real-time insights into risks or a big-picture look at what’s keeping your assets safe, Custom Dashboards bring your security vision into focus.
If you haven’t already, take a moment to explore. Create a dashboard for your next compliance check-in or revamp your vulnerability management approach—you’ll wonder how you managed before.
We’re thrilled to bring you another feature-packed update that enhances ULTRA RED’s usability, functionality, and integration options. Here’s what’s new in this release:
To improve accuracy and minimize duplication in vulnerability detection, we’ve expanded the “Vector Steps” section with new fields:
• Vulnerable Path: The exact URL path where the vector was found and validated.
• Vulnerable Parameter: The specific parameter exploited on the vulnerable URL.

These new details are included in Vector-related API endpoints, CSV, and JSON reports, ensuring streamlined data retrieval and analysis.
Logging in just got easier! ULTRA RED now supports Microsoft Entra ID Single Sign-On, allowing users to access the platform more conveniently.

• New Enrichment Trigger: Trigger playbooks based on newly discovered enrichments, with conditions for enrichment type or description—or both.
• Retry Mechanism: Failed playbooks will now automatically retry up to three times, 15 minutes apart, before logging a failed timeline event.
The Vector card in the Asset Details overlay now displays:
• EPSS Score: For better risk prioritization.
• Custom Tags: To categorize vectors more effectively.

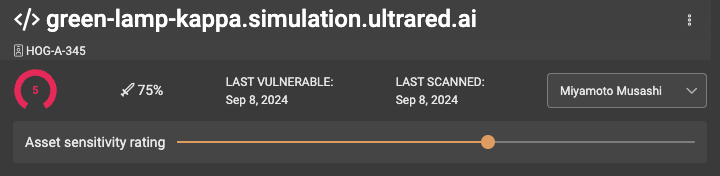
Asset sensitivity ratings have been further refined:
• Displayed directly on asset cards with a thermometer icon.
• Bulk editing capabilities.
• Added as an internal action in Playbooks.
• Included in Findings Reports.
• Available via API and filters.
Our Custom Dashboards feature has been upgraded to maximize flexibility:


Continuing our focus on customization, we’re introducing a new way for you to rate your assets based on their sensitivity to your organization. Some assets may require immediate attention in the event of a critical vector, while others may not. To address this, we’ve added a sensitivity slider to the Asset Details overlay. The slider features 6 steps, from 0 to 5, corresponding with the asset scores, giving you more control over prioritizing asset management.
We’ve completed adding widgets from all pages across the platform. Now, any graph, chart, or counter you’re familiar with can be included in your Custom Dashboards, making it easier to monitor and manage key metrics in one place.
Additionally, we’ve introduced the ability to set a Default Active Dashboard. Users with the Operator role and above can now configure a default dashboard that will load automatically for all users when they access the Custom Dashboards page for a target.

We’ve added two new filters to the Asset Management screen to help you better understand the links and connections between your assets. The Parent Assets filter allows you to view all assets discovered from a specific parent asset. Additionally, the Relations filter—available also on the Discovery page—lets you filter assets based on their relationships to other assets, providing deeper insights into your external attack surface.

You might have noticed a new option in the sidebar for a page we hope will become part of your daily routine. At ULTRA RED, we strive to deliver features that are thoughtfully designed with your needs in mind. While we do our best to anticipate those needs, no one understands them better than you. That’s why we’ve built something that’s not just useful but customizable.
We’ve reviewed all the graphs, charts, and counters across the platform and selected the ones that we noticed are the most useful to you. These have been given a slight visual update and transformed into widgets that you can add to your custom dashboards. You can add them directly from their usual places on the platform via a new button that appears when hovering in the top-right corner.

Or, you can select them from the new Widgets Inventory overlay in the Custom Dashboards screen.

You can create up to 5 custom dashboards, and each dashboard can contain different or identical widgets—your choice.

As of now, the Custom Dashboards feature can be used for various purposes, such as creating an Executive Summary dashboard, a Vulnerability Management dashboard, an Attack Surface Management dashboard, and more.

Using widgets like “Total Assets,” “Average Score,” and “Assigned Assets,” you can build a dashboard that provides high-level insights into your organization’s security posture. This could include key metrics like asset scores, vector priorities, average MTTR (Mean Time to Remediation), and priority distributions. Executives will be able to quickly see trends over time and gain an overall understanding of security risks.

With widgets like “Vulnerable Assets,” “Verified Vectors,” and “Vector Changes in the Past 90 Days,” you can keep a close eye on your organization’s vulnerability landscape. Additional widgets such as “Vector Priorities,” “Vector Changes,” and “Most Archived Vector Tags” can help track the lifecycle of vulnerabilities and highlight those that need immediate action.

For teams focused on asset discovery and management, you can create a dashboard with widgets like “Total Assets Counter,” “Most Common Open Ports,” and “Distribution of Asset Scores.” This setup provides a clear view of your entire asset landscape, helping you quickly identify unmanaged or vulnerable assets.
Widgets can be added to a single dashboard or multiple dashboards at once. Keep in mind, that only one instance of each widget can exist in a dashboard.
You can create a new dashboard in two ways:


Widgets are added in a left-to-right, top-to-bottom layout. To rearrange them, simply drag and drop a widget on top of another one. The dropped-upon widget will shift to the right, and the dragged widget will take its place.

We are excited to announce the latest updates to our Vector Scanner. These enhancements aim to improve the scanner’s performance and provide more and better results for your assets. Here are the details of the latest releaseWordPress Scanner
The scanner now includes scans for vulnerabilities in WordPress plugins, themes, and the WordPress Core version. Helping you identify and mitigate potential risks on your WordPress installations.
When the scanner detects path-normalization in Tomcat, it performs a slight brute-force test for default credentials. If default credentials are found, it can result in Remote Code Execution (RCE).
The scanner’s headless crawling capabilities have been improved to enhance endpoint detection and parameter discovery. Identifying vulnerabilities that might have been missed previously.
The scanner now includes detection for several new CVEs, including:
Additional, less notable, CVEs have also been added.
The enhanced Firebase misconfiguration detection now scans for related information even without a Firebase configuration file on the asset. This includes checks for bucket read/write permissions.
We have improved the scanner’s ability to identify and report XSS vulnerabilities specifically to better detect scenarios involving DOM-related XSS and InJS XSS.
Various bugs have been fixed, and performance enhancements have been made to ensure our scanner runs more efficiently and reliably.
We are excited to introduce Malware vectors as the latest addition to our Vector scanning capabilities. Our scanners can now detect and report malicious files on your assets.
File Path:Each malware vector includes a specific file path, guiding you directly to the location of the malicious file within your system.
Malicious Content Details:The details of the malicious content provide comprehensive information about the threat, enabling you to understand the nature of the detected malware.
The new malware scanner is a paid feature. For more information or to activate this feature, please contact your ULTRA RED representative.

We are pleased to introduce several updates to improve your experience on ULTRA RED. These updates include increased security measures, playbook enhancements, and a reorganized configuration screen. Account Lockout
We have bolstered security by implementing an account lockout feature. In the event of brute force attempts, accounts will be locked for a period to prevent unauthorized access. You can unlock your account before the lockout period elapses by contacting your ULTRA RED contact person.

The playbook’s internal action for sending email notifications when a vector’s status changes now includes a link to the vector and its identifier. This makes it easier to locate the vector you were alerted about.

We have added a failure reason to the playbook timeline. When a playbook fails, the timeline event will now display the reason for the failure, providing better insights when troubleshooting.

The configuration screen has been reorganized and rearranged for better usability. This refactor aims to make navigation and configuration more intuitive and efficient, helping you easily manage settings.

We have changed the default view of vectors to a grouped view. This change aims to eliminate looking for related vectors by grouping vectors representing the same issue, allowing you to simultaneously address multiple related vectors.
For a while now we’ve been looking for a way to tell the story of ULTRA RED. Something that will allow us to explain, in an informative yet succinct, easy-to-understand, visually aesthetic way, what ULTRA RED is all about, from the moment a domain is entered, through discovery and various scanning processes to finding vectors and remediating assets.

Introducing the Overview section: an informative, easy-to-understand visual representation of your data on ULTRA RED. We have analyzed all the main screens you frequently use, extracted the most relevant information, and summarized it into a single, interactive screen comprising six sections and fourteen charts, each dedicated to a distinct and integral part of the process.
Similar to how your data begins its journey on the platform, the Overview starts with the Discovery section and the Related Domains section, representing the first stage of the process. This involves inputting a domain and retrieving related domains. This section includes two charts:

Our platform enables continuous monitoring of domains related to your lead domain. This bar chart displays the number of related domains found for your lead domains, per date. Each bar represents a day when a scan took place, and results were found.
This list highlights your five largest domains on ULTRA RED, compared by the total number of assets discovered from them. Understanding the size of your largest domains helps you gauge your attack surface size.

Continuing with the Discovery screen, the second section reflects information collected in the second column of the Discovery screen.

Similar to the Related Domains, the platform allows to continuously monitor new assets found from the domains. This chart displays the number of discovered assets per date, with each bar representing a day when a scan took place and results were found.

A horizontal bar chart depicting the five most common open ports found on your discovered and assigned assets. The X-axis represents occurrences, and the Y-axis represents port numbers.

The Monitored Assets section is the first section representing the Asset Management screen. It includes two charts, highlighting two key aspects of monitored assets: the number of assets monitored out of the assigned or discovered assets, and the number of occurrences in each asset score. This allows you to identify problem areas and focus your efforts where it matters most.

A funnel chart displaying the amount of current data in each iteration of an asset, from lead domain to monitored asset. This chart helps you easily see and compare the number of assets at each stage of the process.

A horizontal bar chart showing the number of occurrences in each asset score, allows you to identify key problem areas that need attention.

Keeping in line with the Asset Management screen, the Technologies section represents the technologies found on your assigned assets and the outdated ones among them.

This chart displays the five most recurring technologies found in scans of your assigned and assigned & monitored assets.

This chart highlights the technologies found on your assigned and assigned & monitored assets that are most commonly outdated.

The Verified Vectors section summarizes key information regarding vectors and scoring. This section allows you to quickly deduce how many vectors you have, their priorities, tags, and the average score of the assets to which the vectors are attached.

This metric shows the average score on your target, which is derived from the asset scores. The asset score is determined by the highest vector priority attached to it.

A bar chart that distributes and compares all the verified vector priorities on your target.

A horizontal bar chart displaying the most common vector tags on your target, with a distribution of scores along each bar. The Y-axis represents the vector tags, while the X-axis shows the number of occurrences of vectors with each tag and their respective priority levels.

The final section, Remediated Assets, represents the last stage of an asset or vector. This section helps you understand where your work is most invested, which priorities and tags are getting the most attention, and your overall posture, i.e., how many vulnerable assets you still have.

This metric, added a while ago, has been well-received. For managers and team leads, it provides the best indication on ULTRA RED of the efficiency of your teams.

This vertical bar chart contrasts the number of remediated assets versus those that remain vulnerable. The Y-axis indicates the count of assets, while the X-axis differentiates between the "Remediated" and "Vulnerable" categories highlighting the current state of asset security.

This horizontal bar chart displays the most frequently archived vector tags. The Y-axis lists the vector tags, and the X-axis represents the number of occurrences. This provides a clear view of the common vector tags that have been archived.

At the bottom of the page, you can find additional details about your target, like the number of users you have, license usage, active module, and various scanner-related settings.

We have been hard at work on a shiny new feature that will soon be unveiled, but until then, get ready for a slew of quality-of-life features that will aid your day-to-day usage of ULTRA RED. From updates to Playbooks and APIs to a brand-new summary report, this release is packed with some long-awaited and needed enhancements.
The target summary report takes a quick snapshot of key metrics from your target to get a sense of your security posture and identify possible issues. The report consists of two sections, Asset Metrics and Vector Metrics. The report can be generated from the Dashboard by clicking the ribbon in the top right corner, the report will be generated in the background and you will be notified once it is ready. You can check its status in the Reports screen.
The Asset Metrics section provides a rounded view of your asset inventory, including total assets, discovered assets, and assigned assets.
This section also highlights the top five asset categories, helping you understand the distribution and focus areas within your asset inventory. It includes a chart showing the top five most used technologies in your environment, differentiating between total and outdated instances. This visualization aids in identifying potential risks associated with outdated technologies.

The Vector Metrics section offers a detailed view of the threat landscape within your target. It includes:

We understand that our definition and recommendation for auto-archiving a vector may differ from yours so we made a couple of changes to give you some more control over the process. From now on, you can disable archiving altogether. Contact your ULTRA RED contact person to change this setting.
Additionally, we made some changes to the Vector timeline events regarding archiving vectors.


Vectors have always been a core part of ULTRA RED. It is our way of marking the issues the platform finds in a detailed, easy to understand way for you to digest and go to work . Each vector has unique information in the Vector Steps section, information that allows you to replicate our findings and understand what needs to be fixed and how. However, some information is in common with other vectors, the vector’s name which is the asset’s it is attached to name, can be shared between many vectors that are attached to the same asset. The same goes for vector tags, vector tags that represent the same issue on the same asset but with slight variations in the way it can be exploited will appear on all vectors related to that issue, in the same order. So, we took those two common denominators and grouped them together, in a new Grouped Vector view of the Vectors screen. Since these vectors represent the same issue and addressing the issue will resolve all those vectors, it made the most sense.

You’ll notice some minor changes in the upper part of the vector’s details section, there is a new toggle button next to the search bar that will allow you to switch your view from the flat view of single vectors to a grouped view of vectors that represent the same issue.

In the Grouped view, we have a new Grouped Vectors card, on it you can see the vectors name, their tags and a counter of how many vectors are in this group. The score and date are of the most recent vector in the group.

And finally, so you can sift through the vectors in the group, we added a carousel of chips with the identifiers of every vector in the group for you to click through.

We are continuing with improvements to the Discovery Chain from now on, domains that were found using WHOIS search or SSL/TLS Certificate extraction will have the information that led to the connection be highlighted for you to easily understand the connection.

Asset tags are custom tags for users to can be added to assets, they can be added to one asset at a time from the Asset’s details overlay by clicking the editable field and entering tags.

Or in bulk from the Assets hamburger menu, after selecting the assets we want to add the tags to.

To give you some more order and granularity , we added an extra layer of asset tags, now you can create Tag Groups for asset tags and filter for specific groups. Tags can belong to multiple groups. Tag groups can be created from the Configurations menu.

Asset Tags can be seen at the end of the asset cards metadata


We also added a new filter in the Asset Management screen for Tag groups.

We realized you need some form of marking method for vectors for internal use, for instance when you want to denote a vector for further investigation without contacting the ULTRA RED support team, or maybe you want to mark a vector and get back to it at a later time. Since having your own tags on assets serves the same purpose, we thought you could use them on Vectors as well. So, we added custom tags to Vectors. You can now add your own tags to vectors which will appear right below the automatic tags.
The custom vector tags function the same as the asset tags, you can click on the field to activate the text box, enter your desired tags and click enter. Clicking outside the text box saves the tags. Click the field again to edit it. You can find your new custom tags in the “Custom Tags” filter in the sidebar.

As assets become veterans on the platform, their timelines become a long list of important events, so we added a search bar to help you easily find the event you are looking for. You can search for


We heard you about having greater visibility of asset cards in the Asset Management screen so we added a new layout to the cards: Compact Layout.
In the compact layout, we present only the most important sections of data an asset has which are:
You can easily switch between the detailed and compact view by clicking the layout button next to the sort menu.

Until now, we had a playbook that would trigger every time an open port is found. We slightly modified this playbook to trigger every time a new port is found and added the port's status, number, and protocol as a condition. This means you now have more granular control as to when this playbook should trigger. Customers who used this trigger had their playbooks converted to the new one without losing any functionality.
In addition, we added a new playbook trigger for when a port’s status changes. In it, you can define specific port numbers to be monitored for any changes.
Aside from new triggers we also added a couple of new actions:
Due to popular demand, all playbook triggers now have the option to send the playbook data as an email alert. All playbook triggers now have the “Send Email Alert” action at the final stage of the playbook creation wizard.

Finally, on the Asset Created, Outdated Technology, and New Port Found triggers there is a new action to change the asset’s score.
.png)
.png)
.png)

ULTRA RED’s asset discovery capabilities are very thorough and extensive, our scanners often find assets that are long forgotten by the customer, or assets that were created and not reported to the IT department. These situations often require back and forth communication between you and our research support teams to understand how some assets were found and how they are related to the lead domain that was provided in the first step of the discovery.
Related Domains and Discovered assets have an (i) icon that appears on hover, until now clicking this icon would have opened either the Relations overlay for Related Domain or the Evidence overlay for Discovered Assets. Now this icon will open the Discovery Chain overlay for the domain/asset it was opened on.
Additionally, you can trigger the discovery chain directly from the Asset Details overlay, by clicking the same (i) icon next to the asset's name.


The chain is built from the bottom up, meaning the most bottom item in the chain is the one the user interacted with, i.e., opened the chain from, and the most top item is the lead domain the user initially provided on which the discovery process was initiated. In between them are all the assets, data, and connections that ultimately created the chain.
The Discovery chain consists of three types of nodes:
Method - Explanation
WHOIS Search - Fetched WHOIS data of the related domain.
SSL/TLS Certificate Extraction - Fetched SSL/TLS Certificate of the related domain.
Domain Redirection - This Domain redirects to the parent domain.
Reverse Redirect - The parent domain is redirecting back to this domain.
Domain Link - Parent domain has links to this domain.
Domain Backlink - This domain has links to the parent domain.
Co-hosted Domain - Co-hosted on the same server as the parent domain.
HTML Source code - Found connection to the parent domain while analyzing the HTML code of this domain.
Initial Domain - Initial domain that was used in the Discovery of assets process.
Bucket Discovery - Found in our database of cloud buckets.
CNAME Record - The parent domain has an alias to this domain.
SSL/TLS Certificate Reverse Search - Found in our database of SSL/TLS certificates.
Subdomain discovery - A subdomain of the parent domain.
Not too long ago we added the EPSS (Exploit Prediction Scoring System) metric to vectors that have a CVE as their first tag. We wanted to provide you with an insight into the likelihood of this vector being exploited. In this release we have taken it a step further and added an EPSS score to all the Vector tags on the platform, so every vector has an EPSS score, and added a new metric to assets which is based on the highest EPSS score out of all the vectors that are attached to an asset and provide an Exploitation likelihood score for the asset.

We heard you about the Vector Breakdown feature in the Dashboard screen and that it was somewhat counterintuitive, so we gave it an update and now it will better help you find the vector you’re looking for.
The left side still represents all the vector tags that are present on the target, clicking on one of them will show on the right side a list of all the vectors that have this tag. Clicking on a vector will take you to the Vectors screen with the selected vector filtered.

The Asset and Vector identifiers were added so you can easily differentiate between similar vectors, now we added them to all the reports, relevant external API routes and email alerts as well.

You can now export all the data on the Discovery screen into JSON format. Exporting to JSON is limited to 100 items per file due to size limitations.

You might have noticed that there was a gap in the release updates, we took a little extra time to cook up more features for you. In this release we are bringing you a slew of new features. Asset and Vectors are getting a sorting feature, new ways to find, share, and export data, some new timeline events and more.
Have you ever had to call someone's attention to a vector or an asset and found yourself fumbling for ways to specify the vector you are referring to? Well, us too, so we added a couple of features to help with that.
Today, you need to copy the link to the page and manually point someone to the relevant vector. From now on, you can copy a link directly to an asset or a vector. Simply hover on the asset or vector name and a new icon will appear that will copy a link directly to this asset or vector to your clipboard.

Alternatively, you can give someone the identifier to the asset or vector, and they can find it themselves.
On assets the identifier can be found in the asset card metadata and in the Asset Details overlay under the asset name as well.


On the Vectors screen, we added the identifier on the vector card, under the vector name. And in the Vector metadata.


In an effort to bring more order to the timeline, we classified all the existing events into five types, and to make it easier to differentiate between them, we color coded them. The colors we used are the same colors used to denote the asset scores and the vector priorities, we chose them for the same reason we chose them for assets and vectors, they provide context to the importance of each event.
A full list can be found in the FAQ.

Some changes in the Asset Details overlay, we added few more columns in the IP Addresses & Ports card in the Asset Details overlay

We added a couple of improvements to the Vector Validation scanner


From now on you can sort asset cards on the Asset Management screen, you can find a new dropdown menu to the right of the search field. The default sort is by score, you can change it to by:

The Vectors screen also got a sorting feature, you can find a new dropdown menu to the right of the total number of vectors. The default sort is by found date, you can change it to by:

Until now you could only export assets or vectors into CSV format, we initially chose CSV because it is easy and efficient, but the growing complexity of the platform required something more robust. From now on, you can export asset and vectors to a JSON format file.


Due to file size limitations, you can export up to 100 items in a single file. A list of all exported fields can be found in the FAQ
We are moving forward with giving you more control over the happenings on the platform. This release brings with it two new, such features. The first is the ability to use the Discovery scanner asynchronously from the rest of the scanners. The second one allows you to validate vectors on demand.
You can now initiate a scan or analysis and leave the page and the scans will continue in the background. Additionally, results will be coming in as they are found instead of all together once the scan is finished. What this means is that monitored leads and related domains will get more frequent results.
Note: Assigning assets to the target will still require clicking Done.
From now on you can rescan a vector to check if it is still valid. The Test Vector button, which allowed you to execute the payload of a vector, on specific vectors, to check its validity, has been replaced by a new mechanism built to perform this specific task. Checking whether a vector is valid or not.

Depending on the result of the scan, one of two things will happen.


Every vector is unique, what makes it unique is its HASH which is calculated using a combination of:
Multiple vectors can have the same name, and tags, but the ‘Exploit demo URL’ and IP & port are unique to each vector.
We found out that a considerable amount of assets is behind some kind of mechanism that rotates IPs. Rotating IPs is a common practice, it is done for security, load balancing or other purposes, resulting in a different IP address and a duplication of vectors problem. To combat this issue, we slightly changed the vectors' hash to exclude the IP & port. By doing this, we keep the unique part of the vector, the ‘Exploit demo URL' in the HASH and eliminate the issue of a single vector having multiple IPs.
The logic works like this: when the scanner finds a vector, it adds up its name, tags, and exploit demo URL to create a hash, this hash is the VectorID, it then checks whether the VectorID exists in the database, i.e., whether it is unique. If it is, it creates a new vector, if it isn’t it updates the ‘Last seen’ date of the vector.
.png)
We are constantly looking for ways to improve. We want ULTRA RED to be more useful, accurate, and provide actionable information. Recently we introduced the MTTR metric, to provide an insight into the efficiency of your teams, among other things. MTTR is the average number of days between the "First found" and the "Last seen" dates of a vector.
The auto-archive feature until now would kick in after seven consecutive days of a vector not coming up on scans. Before the introduction of the MTTR metric, this was sufficient but since the introduction of MTTR we started to run simulations to check whether we can achieve the same result with fewer days, we found that the three days achieves the same result as seven, any fewer and we got false negatives, any more did not yield better results.
The following is the entire process of an asset being scanned:
In addition, detaching vectors from an asset affects the remediation and assets as follows:
This may sound complicated and a substantial change in the behavior of the platform but in reality, it is not. The only thing that has changed is the number of days that need to pass for a vector to be deemed no longer verified. We have run extensive tests and simulations to make sure the integrity and accuracy of the data remains intact, and the percentage of false negatives does not change.
Following this change, we expect the MTTR metric to be a more accurate representation of how your assets and vectors are managed and you can identify any gaps that may require attention.
We were incredibly happy to hear your feedback about the changes to the dashboard, the good ones, and the less good ones. We set out to make it more insightful and the insights to have a practical and actionable meaning, we still have a way to go but we’re glad to hear we’re on our way there. Following in the same direction, we wanted to allow you to fine tune the data that is presented in the dashboard, and we start with Vectors.
Occasionally there are vectors that require extra attention, whether due to a network anomaly, a honeypot, a false positive or any other reason you might have to flag a vector, you now can.

When a vector is flagged, several things happen in the background:


Often you see a critical or high priority vector on the platform, and you are unsure how much of an actual risk it poses, in regards of it being exploited. The EPSS model predicts how likely it is that a vulnerability will be exploited. We've introduced this statistic to vectors that have a CVE as their initial tag to assist you determine the importance of each vector and prioritize your work.


You can now send an asset to be rescanned, the results can take some time, depending on the size of the asset. In case of failure the scan feature has an automatic timeout.


When we first envisioned the Asset Management screen, we wanted a place for users to quickly get the info they need and get to work. In other words, a screen that drives to action. During the various versions and iterations of this page we tried several views, each one was better than the previous one but lacking in a new way, mostly the ease of access to information. With that in mind, we knew the new iteration should first provide easy access to data. We realized that assets are usually viewed after filtering or searching and having to open categories or the overlay. Or by observing the table but adding or removing columns for different view can be cumbersome, so we got rid of all that. From now on, after searching for assets using the new ‘Search Term Chips’, you will find a new view of Asset Cards.

Asset cards are individual per asset, they consist of general info about the asset, and six sections of bite sized information chips that will answer your quick questions about assets, allow you to easily compare data between assets, and give you exactly what you need to get to work.
.png)
An asset card is divided horizontally into two halves, the top half holds general information about the asset:
The bottom half consists of six sections of all the info that was previously available to you if you activated all columns in the old view.
We got positive feedback about the new MTTR card in the dashboard, and the most common request was “Can we have a separate MTTR for the top priorities”, we thought that it was a good idea so now your MTTR is calculated separately per priority.

As you might have noticed, we are now notifying users of new releases on the platform. And you might be reading this in an email or in our new Product Updates page where you can see all our latest releases.

When an asset has gained some tenure on our platform it has been through several cycles of being vulnerable, having vectors attached to it and detached from it, becoming remediated and so forth. We try to keep a log of as many of the events that transpire on an asset as we can, and we are constantly adding more. Today we are bringing you a new view of the events, from now on, the Asset Timeline will have a heat map of three major events:

The heatmap provides better visualization of the quantity of events within a specific timeframe, in our case, a year, divided into 12 months. We want to help you direct your attention to where it is needed most. A heatmap can help you correlate event frequency with important dates or real-world event.
In addition, those same battle worn assets that have a long and expansive timeline, to make it easier to get to the newest event, we made a change so the next time you open a timeline it will be scrolled down to the bottom, to the newest event.
Following the addition of the relation info to the Related Domains, we wanted to provide you with more such info, in this release we are adding evidence for Cloud assets and IP addresses in the 'Discovered Assets' column on the ‘Discovery’ screen.

Clicking the Information icon will open the Asset Evidence overlay which consists of different information depending on the asset.
For Asset Evidence the overlay consists of the following information:

For IP Addresses the evidence overlay consists of:

NOTE: In some cases, you will see the IP relation data when opening the overlay for a Cloud asset. That's because you are seeing the evidence info for the IP found on the cloud asset.
Evidence can be found in the Discovery screen and in the Asset Details overlay.

At this stage, Evidence is available only for Cloud assets and IP, we are working on adding it to more assets.

This release includes specific enhancements to one of the most used features on the platform, the asset search. More specifically the asset search on the Asset Management screen.
We know that searching has become something we heavily rely on in the infomration age from search engines to pdf documents, we love searching. So, we made it easier to create complex queries so you can enjoy better searching though the assets.
We have expanded the search capabilities of the asset search to include additional sources. Until now, you could search for Asset Names, IPs, and Tags. Now, you can search for Enrichment types and Technology categories and names. With more to come soon.

In addition to adding more sources to search through, we wanted to allow you to construct more complex queries. Complex queries allow for quicker, more accurate data retrieval. From now on, after entering a search parameter, click Enter to turn it into a chip and go on to add another search parameter. A chip acts as ‘CONTAINS’ meaning it will search for anything that contains that parameter, using multiple chips adds the 'AND’ operator between chips. You can use up to five chips in a query.

NOTE: The search bar now requires pressing Enter to reload the data. So, if you are looking to clear the search bar, either delete all the chips and hit Enter or click the little X at the end of the line.

Now that you can search through Enrichments, as well as Technologies, you can narrow your results to find specific tasks that might get overlooked. In this example we look for the 'File Upload Functionality' Enrichment type and 'Apache' from the Technology stack to find assets that either aren't properly validating uploaded files or have no restrictions imposed on the file after it's uploaded.

You can mix and match the chips and the existing filters, in this example we search for every asset with 'Portal' in the name, and filter for a 'CRLF Injection' vector.

We know that dashboards can be pretty powerful, a good dashboard can, for some roles, be all you need to utilize a tool. With that in mind we have set out to make our dashboard better and more usefull. In this release we are introducing some new cards and updating existing ones.

The ‘Average Score’ card provides an overview of the overall state of your assets. We wanted to make it more useful, so we expanded it to include a graph of changes in the past 14 days. Now it can help you recognize trends e.g., sudden spikes or drops in the asset's score can indicate an unusual event.

The 'Monitored Assets' card was meant to provide an overview of how many of the assigned assets are also actively monitored,
but the reality turned out to be that most if not all of the assigned assets were also actively monitored rendering this card static.

Now this card represents the distribution of Assigned, Monitored and Discovered assets.ֿ


You might have noticed that there is something missing from the Dashboard screen and that is the Vectors feed.
We realized that it mostly isn’t being used and that it was prime dashboard real estate that was going to waste.
Instead, we moved the ‘Vulnerable Assets' card their and renamed it ‘Verified Vectors’ and added its counterpart the 'Archived Vectors' card.
MTTR is an important metric, it represents how long it takes on average to remediate vectors.
The card calculates how long has passed from the date the vector was first found to when it was last seen.
Only archived vectors are calculated.

We added native integrations to Slack and Teams for you to send the data collected by the playbook as a Slack or Teams message. From now on every playbook trigger will have two new endpoints:
Selecting one of these options will provide you with a field to enter a webhook that needs to be generated by Slack or Teams, respectively.

Custom HTTP headers allow you to add a signature to scans so that you can easily identify them. For example, adding "X-Scanned-By: ULTRARED" will include this header in all HTTP requests. This same functionality can be used to perform authorized scans that would otherwise get blocked (e.g: error 401, 403, etc.). Adding a bearer token is a good example for that - including session or token information will essentially turn ULTRARED's "black-box" approach into a "white-box" one. Scans will be able to continue instead of stopping on login pages providing you with a scanner that is customizable to your assets.
Custom headers can be added from the Scan Setting page in the Configurations menu.


The asset tags are custom tags you can use to put labels on assets. A creative use we heard of is using it to assign assets to users, with that in mind we added a new feature to the Asset Details overlay that will allow you to assign assets to each other.
Users that are members and higher can assign assets to other users. Users that have assets assigned to them will get a notification saying so, and a timeline event will be created that will specify which user assigned the asset to which user.

Users can also filter for assets that are assigned to them from the filters menu in the sidebar.
.gif)
A saved filter provides quick access to a complex query that provides specific results that cannot be achieved by using a single, built in filter. From now on, you can save a search term as a saved filter as well.
The long-awaited addition to one of our most useful features is the Playbook Timeline. Up till now, there was no record kept about a playbook, you could not know who created a playbook when a playbook ran and what the outcome was, whether or not a playbook has been edited, and by whom. Well, now you can. We have added a timeline to every playbook with events for when the playbook was Created, Edited, Executed Successfully, and Failed. The timeline can be accessed by clicking the 'Timeline' icon next to the 'Trash' icon.


This screen serves as sort of a checkpoint on the platform from which users start working or investigating and continuing their work so it stands to reason to add some quality-of-life improvements to make our users' lives easier.


This newsletter brings a slew of good news and updates. The core of our product, the Vulnerability scanner, has received some major updates that will fortify your cybersecurity defenses. Our latest efforts have focused on incorporating additional features and functionalities that will significantly improve its performance and results.
In the most recent version of ULTRA RED's scanner, we have implemented a smarter crawling component that thoroughly explores every corner of the public internet. This enables us to retrieve information, extract secrets, keys, and tokens. To eliminate false positives, each result is carefully evaluated based on its string entropy.
Exposed credentials could pose a serious risk, depending on access and permissions, threat actors could abuse them to infiltrate infrastructures and services - potentially impairing the confidentiality, integrity, and availability of the impacted systems.
String entropy is a measure of how unpredictable or random a string of characters is. Tokens typically have a baseline of randomness which the scanner measures and compares against to verify the probability of a token. In other words, it tells you how much information or variety is contained within a string, which helps us reduce false positives.
Our Vulnerability Scanner now can identify when one vector impacts another, allowing us to fuse them into a single vector with both associated tags. This comprehensive approach provides a broader understanding of the risks involved. For example, when the scanner detects an XSS vector, it also looks for a CSRF vulnerability. This combination of CSRF with XSS enables an attacker to perform "fly by" Cookie/Session Hijacking from any website using a crafted form.
With enhanced scanning capabilities, our scanner can now delve deeper into directories, providing a more thorough breakdown of all the pages and files associated with each asset.
We’ve improved our scanner’s ability to detect a variety of vulnerabilities such as XSS, open directory listings, SQL Injections, CRLF Injections and Sensitive Server Errors. All while adding additional barriers to prevent False Positives.
We have made significant improvements to our scanner's vulnerability detection capabilities. It can now identify several new vulnerabilities, including XSS, open directory listings, SQL injections, CRLF injections, and sensitive server errors. Additionally, we have implemented additional measures to minimize false positives, ensuring more accurate and reliable results.
We are continuously expanding our vector tags to cover a wider range of vulnerabilities. Some of the new tags include Directory Listing, CORS Misconfiguration, and Improper Error Handling. We are committed to regularly updating and adding more vector tags to provide a comprehensive understanding of the potential risks.
Like the Vector Findings report, the Asset Findings report provides a summary of all the information related to an asset and all the vectors attached to it. It can be generated from the Asset Details overlay of any asset.
An asset findings report is comprised of all the data on an asset and the vectors attached to it. The first part of the report details all the information about the asset including any IP addresses and ports, Enrichments that were found on the asset, the Timeline of events, any Notes that were left on the asset, and the Remediation steps. The second part of the report is about the vectors attached to the asset. Every vector gets a Vector Details and a Vector Steps card.

The report is individual for each asset and therefore can be generated from each asset's Asset Details overlay by clicking the 'Export Findings' button under the cover photo. The platform will notify you once the report is ready, clicking the notification will take you to the reports page where you can download the file.
When you enter a domain in the first column of the Discovery screen, our scanners do their magic and find any related domain they can to the provided domain. The found relations between the domains is broken down into six:

We got some feedback that the terminology in the Playbooks screen is a little confusing, so we updated some of them. From now on, in the first step of the playbook creation wizard, you will be selecting a Trigger for the playbook instead of an action. In the second step, where you previously had an option to select a trigger, will now be named Condition.

You can now add enrichments using the external API. Your added enrichments will appear in the Enrichments card in the Asset Details overlay. Enrichments added via the API will be marked with an asterisk (*).

Method to use is POST
Send the following in the body of the request:
If any of the fields are not provided the API will return an error stating:
"Enrichment(s) not added, check fields and try again."
This release contains even more Playbooks upgrades, to allow you to perform internal actions automatically. In addition, the external API is getting another update needed to allow you to customize targets with your own data. And finally, the vector scanner received a new, useful ability.
Playbooks are getting even more upgrades. We wanted you to have more actions to choose from when building your playbooks, so we added a new action type - Asset Created. The new action type allows you to create a playbook that will trigger once a new asset is created, whether it was assigned from the discovery or created manually.

Playbooks can also run internal actions, you can find them in the Endpoint step. The Endpoint URL field is now a dropdown menu in which you can choose between an external endpoint or an internal action to be performed by the playbook.

'Vector Created', 'New Discovered Asset', and 'Asset Created' also have internal actions:


You can already create your own assets on the platform, both from the GUI and the API. Now you can also create vectors using the external API by providing all the necessary information in the body of the request.
Having the ability to create both assets and vectors via the API allows you to add findings from other third-party tools you might employ, aggregating all the cyber security of the external and the internal perimeters into a single, centralized location.
Good news for users with more than a single target assigned to them, targets will now be sorted by targets with the most monitored assets first.
How great are filters? They allow us to enjoy grain free coffee, breathe cleaner air, and provide our cars with refined fuel. They also allow us to sift through copious amount of data about targets and present specifically what we need. Therefore, this and the next issue will be focusing on filters. Starting with the Asset Management screen in this newsletter and then Vectors in the next one.
In this newsletter we are going to explore some of the things you can do with the Asset Management screen filters which includes three types of filters:
Toggles offer the most general type of filter. Meaning that only using the toggles we cannot really get too deep and specific into the data. To do that we would need to combine several filter types and filters within the filter types, we will talk about that later in this newsletter. For now, let's focus on general filtering. For example, we can display all the new (added in the last 10 days) and vulnerable (have vectors attached to them) assets using just two toggles.

The filters listed above function as separate entities, we can mix and match several filters to create a new, custom filter which can be saved to be used later. This allows us to achieve granular control over the data presented by the platform.
SSL certificates are used in every web application, it is crucial to an organization’s security posture to have all their certificates use strong encryption ciphers, be up to date and signed by a well-known certificate authority. Using the 'Enrichment Type' filter we can create a new filter that will display any SSL issues your assets may have.
.gif)
There are cases where we want the platform to display certain information and not display other information. For instance, let’s say we want to display all the web servers under the target, one way to do that is to scroll down to the ‘Technology Category' filter and select ‘Web Servers'. Another option, if we want to be more specific with it, we can go to the 'Technology Type’ filter and select which web server types we want to display or not to display.
In the example below, we wanted to display only Apache Web Servers, so we first filtered out all the Web Servers and then got more specific by selecting only Apache web servers and not regular HTTP server or Nginx servers.
.gif)
While being very powerful, there are some vectors which are difficult to detect using conventional methods, that the platform can’t detect yet. This does not mean however that it cannot provide some indication wether or not there are assets that are susceptible to such attacks.
The platform can detect which technologies are used on assets; we can use that data to provide insights into the preparedness of our assets to face such attacks.
By filtering using these technologies, whether they are present or not, we know which assets are protected from these attacks and which are not and can take appropriate action.

Not long after its addition to the ULTRA RED roster, the Playbooks screen receives a facelift. From now on clicking the ‘+ Create Playbook' button will open an overlay with a step-by-step creation wizard.
The steps correspond with the three columns of the previous version with the addition of a summary page in which you can review your playbook and test it against the endpoint it sends the data to. You can go back and forth the steps and change anything. In the Summary step the fields are not editable.

Existing playbooks can now be edited, the ‘Name', ‘Category’, and ‘Endpoint URL’ of a playbook can be changed after creation and tested prior to saving the changes. Simply click on an existing playbook and the ‘Summary’ step will appear. Don’t forget to click ‘Save' once you’re done.

Following the new additions to the platform, we added a new filter to the Asset Management screen and the Vectors screen.
Cover photos on assets provide a visual representation of them, so we added a new toggle filter to help you find assets that have a cover photo.

We added a new date picker for the ‘Last Scanned’ date of vectors. Combining this filter and the ‘Found Date' filter, you can gain insights into your Mean Time to Remediation (MTTR) on vectors.

We are glad to announce that a new report has joined the roster, the Vector Findings report. The new report provides a summary of all the information related to a vector and the most relevant information from the asset it's attached to.
A vector findings report is comprised of part Vector data and part Asset data. From the Vectors screen, the Vector Details, Vector Steps which includes all the info from this section apart from sensitive information like leaked credentials, and the Vector Timeline. From the Asset Details overlay, it includes the Remediation Steps, and the Technology Stack.

To make way for the new report’s export button, the Vector Status has been moved to the Vector Details pane.
The report is individual for each vector and therefore can be generated from each vector’s page by clicking the 'Export Findings' button right next to the 'Text Vector' button. The platform will notify you once the report is ready, clicking the notification will take you to the reports page where you can download the file.

The Vector part of the report is the first three cards. They provide all the relevant information about a vector like its basic info, the steps taken to find and validate this vector, and the timeline of the events.

In the second part of the report, we get the relevant data about the asset the vector is attached to. We want to know what the remediation steps for the vector are and whether there are outdated technologies that need attention.


You asked for it and now it is ready, we have created a new user role in the system. It’s like the member, but with even fewer write permissions. Basically, as the name suggests, it can only read data. It's intended to give managers more granular control over how other users interact with the data without affecting it.
The Member role has also received an update, members now have limited access to the API and Proxy pages.
Good news, in an effort to provide you, our valued users, tips and tricks that will help you make the most of the platform, we have decided to start sending a newsletter. The newsletters will focus on different areas of the platform, sometimes a series of newsletters on the same topic, and other times a single newsletter on a single topic or several small topics.
Now that we have playbooks on the platform, we can start creating custom automations. These automations will help integrate Ultra RED with your other security solutions, by taking the data collected by the platform and sending it via an API to your choice of product. In this issue, we are going to provide you with some examples of possible uses for this feature. We hope this issue will spark your creative juices and you will create your own playbooks that will make yours and your team's life just a little bit easier.
PHP is a scripting language focused on web development. About 70% of all websites online today use PHP. As such, it is bound to attract a lot of attention from malicious actors that constantly develop new ways to exploit websites and exfiltrate valuable information from them. The people over at the PHP development team are hard at work on creating better, more secure versions of their product, it is the job of consumers of this product to keep it up to date. We can build a playbook that will trigger each time PHP is discovered by the Technology Scanner and that it is marked as outdated technology.

To do so, we first enter the basic playbook details like name and category. Then, we select under Action ‘Outdated Technology'. The property to look for should be ‘Technology Name’ and the value should be ‘PHP’. Finally, we need to enter the API endpoint of the patch management software and that’s it.
Critical vectors are very time sensitive. They require the quickest time to remediation simply because of the higher risk factor. Therefore, it stands to reason that we would want to be notified as soon as possible when such vectors are found. In the pre playbooks era, this was done via emails, in the post playbooks era we can build a playbook that is triggered by priority 5 vectors and sends the vector data to a slack channel, for the entire team to be alerted at once.

To create such a playbook, we need to first fill in the basic info like name and category. The action that would trigger this playbook should be a new vector created, the property the playbook should focus on is Priority and it should be 5. Finally, we need to provide the API endpoint to which we want to send the data about the vector, in this example a Slack channel.
As organizations grow, the amount of digital assets they have grows accordingly. Dev, support, QA and other teams are always creating new assets, development environments, testing environments, replicated environments, and sometimes they forget to notify the IT team. Since the platform can discover new assets per domain, assuming monitoring is turned on, but not sub domains, we can use playbooks to monitor for specific subdomains and be alerted soon after they have been created.

For this example, we want to monitor the dev.ultrared.ai subdomain and alert an IT system of a new asset that was created. To create this playbook, we first need to provide basic details like the name and category. Then we need to select the action to trigger the playbook, in our case that would be ‘New Discovered Asset'. Next, we select the property the playbook should focus on, in this example that would be the asset name, and provide the subdomain. By unchecking the 'Exact Match’ box we make sure that every new domain under dev.ultrared.ai will trigger the playbook.
There is a new section in our knowledge base, the API Guide section, it includes information about every API endpoint we currently offer and how to use them. We are always adding more functionality to our API so you can use the data as you wish. Whether you are creating fancy dashboards or forwarding the data into other tools, we want you to use the data.

The API Guide can be found at the bottom of the knowledge base, and the knowledge base can be accessed by clicking the little book icon next to the notification bell.

The Targets endpoint allows you to request the information seen on the targets page. This endpoint provides the four most basic pieces of information about a target on the platform. It is more relevant to customers with more than one target on the platform.
Method to use is GET

The response from the endpoint includes the following:
The Dashboard endpoint provides a summary of a target. It is comprised of cards providing a high-level view of the target.

Method to use is GET
The response from the endpoint includes the following:
The Vectors endpoint is used to request a list of vectors on an asset. It can be used to request a list of all the vectors or within a specific time frame by sending dates in the body of the request.

Method to use is POST
The response from the endpoint includes the following:
To request for vectors in a specific time frame, send the following as part of the request body and replace “dd/mm/yyyy” with a date:
The Assets endpoint is used to request for all the assets on a target. Part of the response also includes the technology scanner’s results i.e. all the technologies found on the asset and whether they are outdated or not. Note that technologies are dynamic, and some fields may not be included in the response, based on the information that is available.

Method to use is GET
The response from the endpoint includes the following:
The Discovery endpoint is used to get information about all the assets that were found by the platform. The API responds with all the data in the target’s discovery page, divided into three categories, assigned assets, discovered assets, and related domains.

Method to use is GET
The response from the endpoint includes the following:
It is possible to manually create assets and add them to the Asset Management screen.

Method to use is POST
Include the new asset’s name (IP, domain or hostname) according to the format below:
The response from the endpoint includes the following:
The system’s scanners and requests are constantly rotating through a pool of pre-defined IPs, which are rotated approximately once a month.
To get the list of IPs being used by the scanners at any given moment you can use the Proxies endpoint.

Request to use is GET
The response from the endpoint includes an array of IP addresses.
We are making strides in creating more automation on the platform. Our goal is to make your life easier; we want our platform to provide you with useful, intelligible, information that you can translate into action.
Let’s face it, our platform is pretty useful. It lets you know when it finds a new vector or asset or outdated technology, the next logical step would be to allow you to take this information and act upon it however you see fit. Enter Playbooks.
Let’s say the platform found that your web servers are running an outdated version of jQuery. If you employ a patch management system in your organization, you could create a playbook that will send this data into said patch management system to initiate the update process. Alternatively, you could create a playbook that will open a ticket in a ticketing service like Jira or ServiceNow.
Another use could be when the platform finds a new vector, you could create a playbook that will forward the new vector details into a SOAR platform that will act upon the provided information based on some predefined rule set.
Our version of this idea begins at the moment the platform has informed you that it has found a new vector, asset, or outdated technology. Each of these discoveries can be set as a trigger to run a playbook. Within the playbook you can select the conditions for the playbooks to run upon, and where to send the data i.e. an API endpoint of some other tool or service.
Next time you login to the platform, you will see a new screen, Playbooks.

The first time you visit the Playbooks screen it will be empty, we can remedy that by clicking the '+ Create Playbook' button.

A window will open that will guide you in creating your first playbook.

For the first part, you will need to provide some basic information like the name of the playbook and its category. Categories are created by you and will appear as tags under the playbook name. They can be anything you want, either by the endpoint you are sending the data to, or by the finding type on our platform. Whatever it is, try to be consistent and mindful of any special characters you are using. To prevent accidentally creating multiple categories for the same thing. Tags are case insensitive, but it is not unheard of that a hyphen is used when a space is required.
Select which action on the platform should trigger the playbook. For instance, when a new vector is created.
Next, select which properties the playbook should focus on and what value it should look for.
And finally, enter the endpoint URL to which the data should be sent, click save and your playbook is done and ready to work.

Playbooks will be covered more extensively in our upcoming newsletter.

This release includes several new major features and a few minor ones. We added a new Asset Analysis report and upgraded the existing CSV reports. In addition, we added more fields to the external API to enhance your ability to generate your own report and dashboards.
The biggest addition in this release is the new Asset Analysis report from the Asset Management screen. The new report is meant to summarize the entire complement of the assets on a target and provide several views on the posture of a target. The report can be generated from the Asset management screen and downloaded from the reports screen or generated directly from the reports screen.

The entirety of the report is divided into three parts:
In this version only the first two parts of the report have been released the appendices will be released soon. The cover page of the report provides a brief summary of ULTRA RED and the date the report was generated on. The second page of the report provides quick, valuable insights on the status of the assets in the form of summarizing cards. Each card presents two charts a donut chart and a bar chart. In total there are four cards.
The donut chart on this card is meant to provide an overview of the total number of assets on the target and the number and percentage of them that are being continuously monitored.
The bar chart on this card provides insight on number of monitored assets on the target divided into categories.

This card describes the vulnerability of the the target, the donut displays the percentage of vulnerable assets and the last vulnerable date, meaning the last date the target had assets with vectors attached to them. And the bar chart details the how many vectors were found each day in the past thirty days.

In this card users can see how many assets are currently using outdated technology on the target. The donut displays the percentage and the actual number of assets that are using outdated technologies. The bar chart details what are the most common outdated technologies on assets on the target

The donut displays the percentage of assets that were remediated out of the total number of assets on the target. And the date of the last asset that was remediated. The bar chart details the number of assets that were remediated each day for the past 30 days.

The existing CSV report exports most of the fields in the Asset Management page, however since its previous update, more fields have been added and some, less used fields, have been removed. In the new Asset CSV report we wanted to remove the old, no-longer-in-use fields and add new ones that are missing. In addition the order of the fields has been also modified slightly. The new report includes the following fields in the given order.
Similarly to the Assets CSV report, the Vectors CSV report has also been overhauled to exclude less used fields and include new ones that have been missing from the report. The new report includes the following fields in the given order.
The external API of vectors has been expanded significantly. Now users can request for a vector's status, whether it is verified, archived or marked as accepted risk. The vector’s tags can also be request via the API and the information available in the proof of concept section of the vector details.
With the newly added fields to the Vector’s screen API, the requested data along with the data which can be requested from the Assets API, users can now create their own dashboard and reports which will display the data that is relevant to them in any manner they find most useful.
In addition, the Targets API had a minor addition of the Monitored Asset counter.